Dora Metrics for DevOps
In this article, we will cover some incredibly practical and actionable tips for implementing DORA metrics.
- What are DORA metrics, and why are they useful?
- What do you need to properly compute for DORA metrics?
- How can you successfully implement DORA in just a few minutes with an open-source solution?

What are DORA Metrics
Created six years ago by a team of researchers, DORA stands for “DevOps Research & Assessment” and is the answer to years of data analysis, having examined thousands of teams, seeking a reliable and actionable approach to understanding the performance of software development teams.
DORA has since become a standardized framework focused on the stability and velocity of development processes, one that avoids the more controversial aspects of productivity measurements and individual performance metrics.
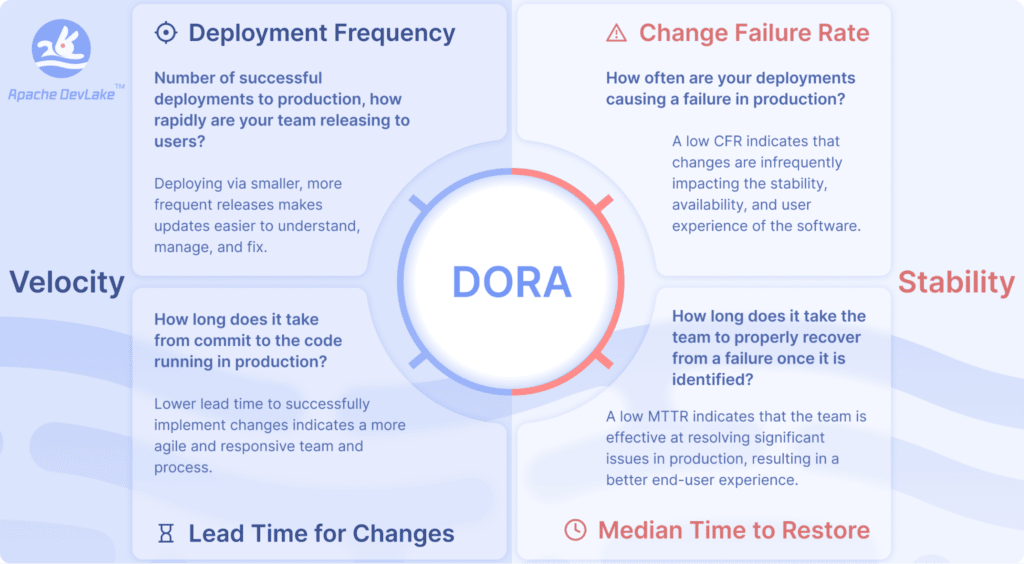
There are two key clusters of data inside DORA: Velocity and Stability. The DORA metrics framework is focused on keeping these two in context with each other, as a whole, rather than as independent variables, making the data more challenging to misinterpret or abuse.
DORA Velocity Metrics
Within velocity are two core metrics:
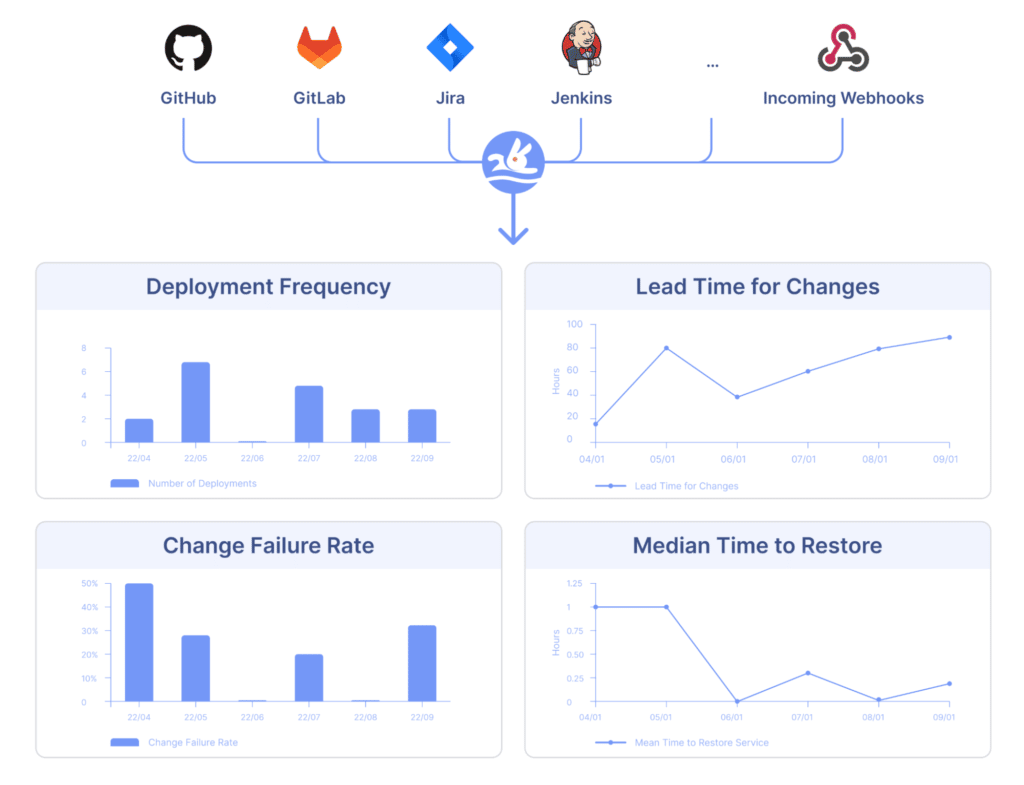
- Deployment Frequency: Number of successful deployments to production; how rapidly your team is releasing to users
- Lead Time to Changes: How long does it take from committing the code to running in production? This is important, as it reflects how quickly your team can respond to user requirements.
Naturally, if you are pushing a consistently high tempo, you also want to ensure that the work being delivered is reliable, and that downtime and failures are readily recoverable.
DORA Stability Metrics
Stability is composed of two core metrics:
- Change Failure Rate: How often are your deployments causing a failure?
- Median Time to Restore: How long does it take the team to properly recover from a failure once identified?

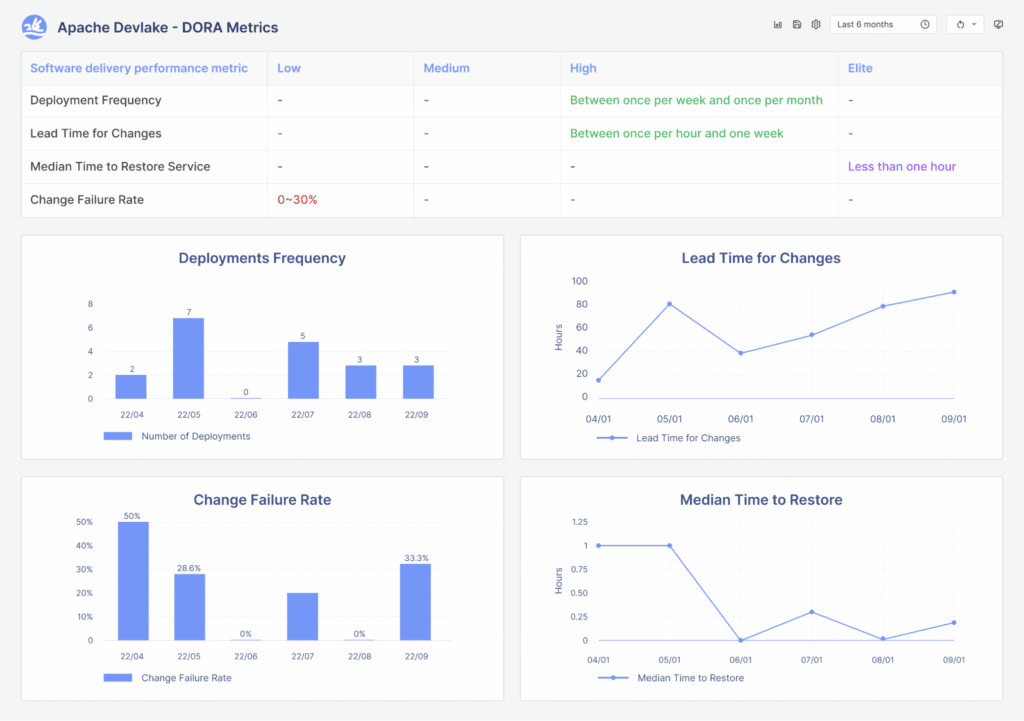
To make DORA metrics even more actionable, there are some well established benchmarks providing a simple lens to determine if you are performing at “Elite,” “High,” “Medium,” or “Low” levels.
Challenges Implementing DORA Metrics
While DORA isn’t necessarily new, implementing DORA metrics has proven out of reach for many companies and teams due to the challenges associated with obtaining, unifying, querying, and visualizing the necessary data.
An inherent complication to implementing DORA properly is that the required data typically lives in many tools, accounts, and formats, making the process of compiling it difficult, manual, and time-consuming.
Team configurations and processes are often quite unique, using different delivery processes, definitions, and standards. Ultimately, meaning that “one size fits all” really means “one size fits nobody” when it comes to many of the existing solutions that claim to deliver DORA metrics.
The aforementioned challenges are part of why the team at Merico built DevLake, an open-source dev-data platform that collects, analyzes, and visualizes data from many developer tools in the most transparent and customizable package possible.
And recently, Merico announced robust support for the DORA framework, to make it easier and more accessible than ever before for teams of all shapes and sizes to put this powerful data to work!
Implementing DORA Metrics with DevLake
The Sources You Need, and How DevLake Computes DORA
Three key entities for computing DORA metrics include:
- Changes: For most teams, this is simply pull requests (PRs), so this data will come from code hosting tools. DevLake currently supports GitHub, GitLab, and BitBucket.
- Deployments: This data comes from your CI/CD tools. DevLake currently supports Jenkins, GitHub Actions, and GitLab CI, with CircleCI in development. DevLake also has a custom web-hook that allows you to push deployment data to DevLake if your CI/CD tool isn’t yet supported.
- Incidents: This is the source for stability metrics. DevLake is going to soon support PagerDuty and Sentry to make this data even more effective.
In just four succinct steps, DevLake can overcome the aforementioned challenges and get you properly.
- Setup DevLake: Using Docker Compose and Kubernetes, Helm, or Temporal.
- Collect Data: With DevLake’s versatile connectors, you can extract the data you need from many tools.
- Launch Ready-to-Run Dashboards: DevLake comes pre-configured with many metrics and dashboards, including full DORA support.
- Customize: You can personalize and even create brand new metrics and dashboards in DevLake with just a few SQL queries.

Once you have set up DevLake, connected the data sources, and run the necessary pipelines for collection, DevLake will be ready to render a complete DORA dashboard leveraging the power of Grafana.
Whether you want to implement DORA in its standard format, or develop more advanced and specific dashboards, with DevLake, you’re only a few clicks and queries away.
About Hezheng Yin
Hezheng is the co-founder and CTO of Merico, a growing tech company focused on assessing code and software delivery processes. He is also the creator and lead maintainer of DevLake, the open-source dev-data platform, currently being incubated by the Apache Software Foundation.
Hezheng began his journey assessing and benchmarking software and software delivery processes during his time in UC Berkeley’s computer science PhD program, studying algorithms and methodologies to assess code contribution. His research catalyzed Merico and DevLake, both of which have become global technology leaders.
 GitKraken MCP
 GitKraken Insights
 Dev Team Automations
 AI & Security Controls