Rank every agent. Measure every outcome. Prove the return.
Rank
Every agent on your team, ranked by what they shipped, what they cost, and what made it to production.
Measure
Output in business terms. Delivery velocity, capacity returned, features shipped. The metrics leadership asks for.
Prove
The ROI of every dollar of AI spend. Per tool, per team, per developer. Board-ready.
Four questions every engineering leader is being asked about AI. Four answers.
1.
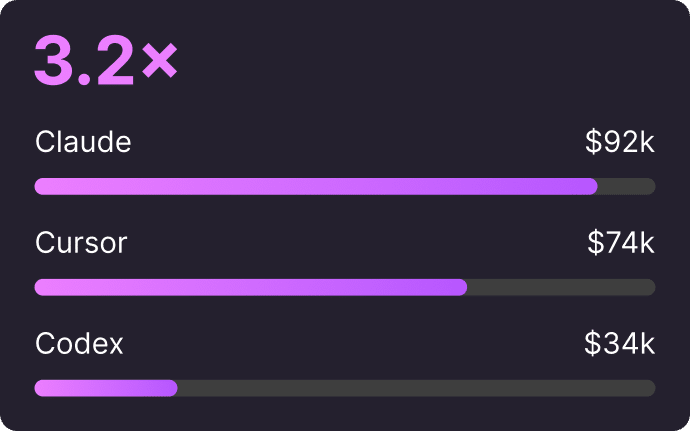
AI – Business Impact & ROI
The return on every dollar of AI spend.
Change in productivity, additional developer hours, capacity returned in dollars. Per team, per tool, per developer. The numbers your CFO will accept.
2.
AI – Adoption & Autonomy
See who's using agents, and how deeply.
Two scores per developer. Adoption measures daily use, depth, and output. Autonomy measures how much of the work is handed off to agents. Cohorts surface who’s leading, who’s learning, and who needs help before the rollout stalls.
3.
AI – Repo Readiness
Know which codebases are ready for agents.
Every repo scored on what agents need to work well. AI instruction files, CI configuration, test coverage, build reliability. Action items when something’s missing. An agent is only as good as the repo it’s working in.
4.
AI – Tool & Model Performance
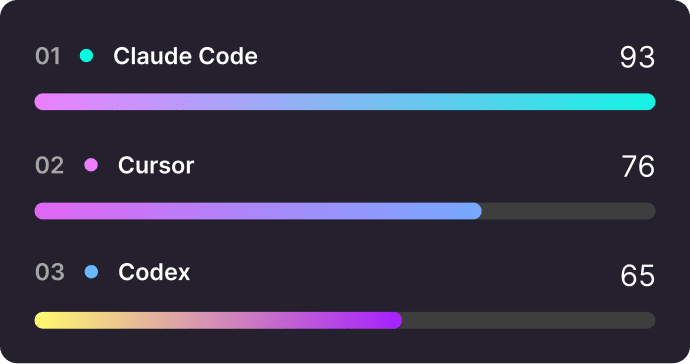
Rank Every AI Tool & Agent Your Team Uses.
Claude Code. Cursor. Codex. Plus every model powering them. Per developer, per team, per task. Cost, cycle time, PR size, bugs shipped. The scoreboard you open when someone asks which tools to cut.
The full picture of how your team ships
DORA, PR flow, code quality, and developer sentiment. In one platform.
DORA
DORA metrics in context.
All four. Deploy frequency, lead time, change failure rate, MTTR. With the trend context that tells you whether a spike is noise or a pattern.
PR Flow
Find where PRs get stuck.
Pickup time, cycle time, review load, post-merge defects. See what’s slowing your team down.
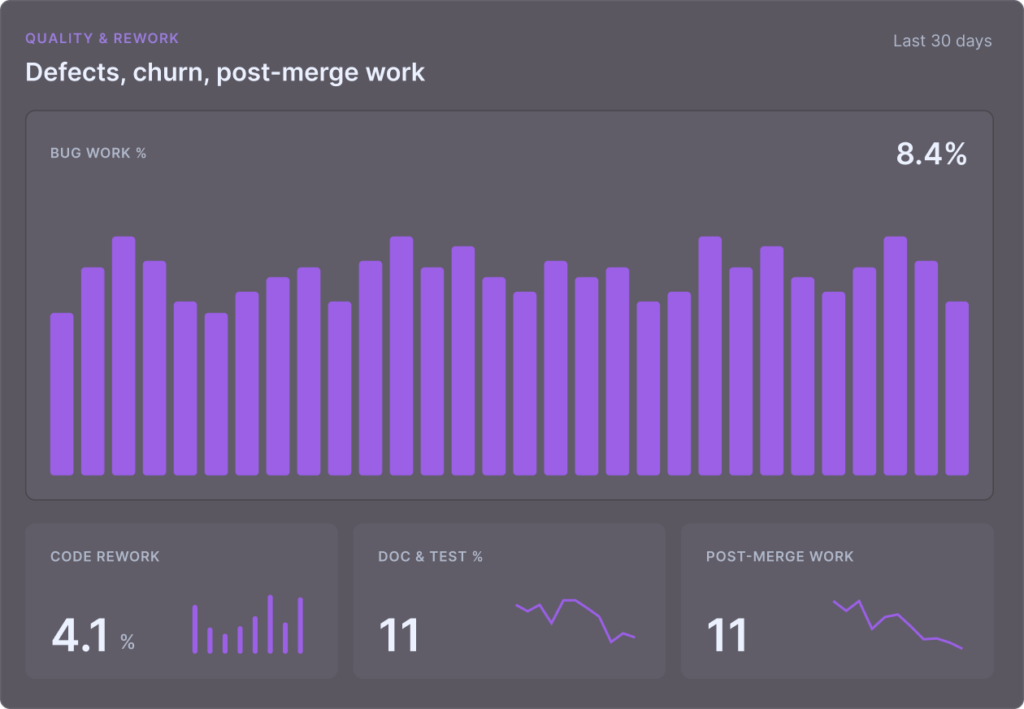
Code Quality
Code quality, beyond linting.
Churn, copy-paste, tech debt hotspots, complexity by directory. Know which code is slowing you down before it becomes an emergency.
Sentiment
Sentiment as a leading indicator.
Flexible surveys that correlate how developers feel with how they’re performing. Honest responses from a brand 40M+ developers already trust.
Built for How You Lead
Engineering Executives
Walk into the board review with the AI ROI number.
Defend the AI budget with cost-and-return data, per tool, per team
See whether AI is accelerating delivery or adding to the line item
Tie engineering output to the goals your CEO is tracking
See team health without asking anyone for a status update
Engineering Managers & Team Leads
Run the team. Including the agents on it.
See which agents are working for which developers. And which aren't
Spot stuck PRs before standup
Catch velocity drops and sentiment dips before attrition
Walk into retros with data your team trusts
Platform & DevEx Leaders
Roll out AI. Prove it worked.
Score every repo for agent-readiness before the rollout starts
See adoption and autonomy by team, cohort, and developer
Compare every AI tool your team uses side by side
Build the business case for the next round of AI spend
If your team uses it, Insights measures it
GitHub, GitLab, Jira, Linear, VS Code, Cursor, Claude Code, Copilot. Plus whatever you roll out next.
The only engineering intelligence platform built for
agent-led engineering.
GitKraken Insights is an engineering intelligence platform that helps teams measure and improve their software delivery performance. It automatically tracks DORA metrics (deployment frequency, lead time, change failure rate, and mean time to recovery), provides visibility into AI tool impact on productivity and code quality, and identifies workflow bottlenecks across your development process. With 15-minute setup and seamless integration with your existing Git repositories and CI/CD tools, Insights gives engineering and product leaders actionable data to optimize team performance without the complexity and cost of enterprise alternatives.
Insights was designed for engineering leaders who want meaningful visibility without the overhead. If you’re struggling to understand how work flows through your team—how long code reviews take, where quality drops, or where bottlenecks hide—Insights gives you clarity with metrics that actually matter. No digging through dashboards. Just real-time, actionable dev intelligence.
Insights is available with GitKraken Advanced, Business and Enterprise subscriptions. Additional Insights-only seats are available for broader team coverage, providing visibility into development activity for all team members regardless of whether they are using GitKraken tools or not. This ensures complete team visibility across your entire engineering organization.
GitKraken Insights gives engineering leaders the visibility they need to make data-driven decisions about their teams and processes. It automatically tracks DORA metrics to benchmark performance and identify improvement opportunities, measures the real impact of AI coding tools on productivity and code quality, and surfaces workflow bottlenecks that slow down delivery. Instead of relying on gut feel or building custom dashboards, engineering leaders get actionable insights in minutes—helping them optimize team efficiency, justify tool investments, and demonstrate engineering impact to stakeholders.
GitKraken Insights can be set up in approximately 15 minutes. Simply connect your Git repositories and CI/CD tools, and Insights will automatically start tracking your DORA metrics and engineering performance data. There’s no lengthy implementation process, complex configuration, or months-long setup required—unlike enterprise alternatives that can take weeks or months to deploy.
X
See GitKraken Insights in Action
Take an interactive tour to see how GitKraken Insights helps you quantify AI’s impact, spot bottlenecks, and prove engineering ROI.
X
Visual Studio Code is required to install GitLens.
Secure cloud-backed services that span across all products in the DevEx platform to keep your workflows connected across projects, repos, and team members
Launchpad – All your PRs, issues, & tasks in one spot to kick off a focused, unblocked day.Code Suggest – Real code suggestions anywhere in your project, as simple as in Google Docs.Cloud Patches – Speed up PR reviews by enabling early collaboration on work-in-progress.Workspaces – Group & sync repos to simplify multi-repo actions, & get new devs coding faster.DORA Insights – Data-driven code insights to track & improve development velocity.Security & Admin – Easily set up SSO, manage access, & streamline IdP integrations.
 GitKraken Desktop
 GitLens for IDEs
  GitKraken MCP
 GitKraken CLI
 GitKraken Insights
 Git Integration for Jira
 Supercharge Your Dev Team
  Secure Your Dev Team


 Measure


 DORA
DORA